SpatialTimes 2014 Year in Review

The numbers are finally in, and 2014 was a great year for SpatialTimes.com. Sure it wasn’t a full year, as the first post wasn’t even posted until April, but the year still ended right on time. There were many draft posts at the beginning but it was hard to hit the publish button as a rookie blogger. Eventually I tossed many of those draft articles as they became stale before they were finished, or I just wasn’t happy with the final product. Overall, the posts continue to be related to what I’m working on or discussing with other Geo-Geeks at the time. So let’s take a look at the SpatialTimes year-ish in review…
SpatialTimes: The numbers
These numbers are summarized from Google Analytics. They don’t necessarily align with the JetPack stats, but there is already lots of articles on that topic. That said, my learning curve with WordPress has also changed over the year, so some results can be a little misleading at times (which will hopefully be explained).
Who are We/You/Us
Being the first year, it’s no surprise the user base was mostly New Users (78.5%) compared to returning (21.5%). Total sessions/pageviews has been trending positive every week/month so far - even the Christmas season didn’t stop the trend! As a new blogger, this is very exciting and I hope you keep coming back for more. That said, this blog doesn’t generate revenue, just nice to know we aren’t alone when it comes to GIS.
 2014 Sessions and Views - Yippee, the dots are headed in the right direction!
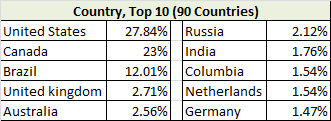
The top 10 Countries (by total sessions) held a little more interesting. The US and Canada accounted for over 50% of all visitors, with Brazil coming in 3rd with 12.01% (the only other Country with double digits).
These numbers, along with a few others, have changed dramatically since I started blocking more spam site referals over the winter holidays, but they are the only numbers I have at this point. Spam sites also inflated the bounce rate [def: Percent of single-page visits] for the first year, up as high as 53%. The bounce rate is now 17% since updating the htaccess file - thank you Internet machine and Google Search! Below is a chart showing the 2014 to 2015 change in bounce rate after the WordPress updates were complete. The Bounce Rate bounces lower while Sessions continue to flourish. Phew! If you notice sites like “semalt-semalt” clogging your referrals, I’d recommend reading a few articles and forums on the WordPress site on the many ways you can start blocking them from your site and stats. Not only will it help you better understand your visitors and what is really happening on your site, but also helps you dive a deeper into the world of WordPress and the never-ending battle with spam (if so inclined).
 2014 Bounce Rate Fixed in December (Bounce rate bounces lower while Sessions continue to flourish)
Top posts
Here are the top 3 posts of 2014. Why 3? It’s more than 2, and less than 4 - for more details on my logic, I recommend watching Monty Python and the Holy Grail - repeatedly.
#1 - ArcGIS Collector External GPS Options: Although posted in late November, this quickly jumped up to be the most popular post in 2014. An odd time of year (in Canada) to start posting on field collection, but I had a great time researching and writing on the topic. At work we still use the iPad + Collector + External GPS combination and are very happy with the results so far. More posts on this topic once the snow has melted.
#2- Shapefile vs. Feature Class: The second most popular post, and for good reason - it can be confusing! I’ve been talking/teaching about this one for years and always makes for good trivia. With the resilience of the shapefile, this might be popular for while yet.
#3 - Feature class export into native sql server table: ArcPy, SQL Server, and ST_Geometry - yes please. I was a little surprised with this one since it is more code/dev focused. But I do enjoy writing code (html, js, python, sql), and it seems you do too! So more to come in 2015.
The Browser Wars
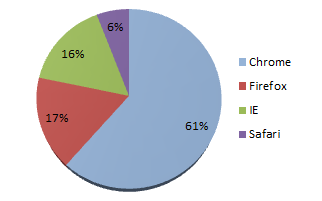
An overwhelming 60% of visitors are using Google’s Chrome browser to visit SpatialTimes.com. I use all 4 of the top browsers, and my usage breakdown is very similar. It’s troubling, but if one was to breakdown the IE usage, you don’t want to know how many people are still using IE 6-8.
This is one reason why we are still developing websites that require so much backwards compatibility I guess. The total browser numbers do combined both mobile and desktop usage- however at this point mobile only accounts for 9.23% of total traffic. Take these results, along with time of day numbers, and it seems like most are reviewing on their work desktop. Makes sense, as I’d imaging there are more GIS industry people than weekend tinkerers. [Full Disclosure: I’m both]
Now What?
Back to the grind all 72.14% of you reading this at work. Or maybe add this site to your Feedly list, or your bookmarks if you haven’t already - or read a few more posts while you are here. A special thanks to all the SpatialTimes readers/followers for a great 2014, and looking forward to more in 2015!
If you found my writing entertaining or useful and want to say thanks, you can always buy me a coffee.


